Back to Home

OnePay Research Archive

Not all of my research made it into the final case study. This archive shows the raw inputs, exploratory sketches, and everything that contributed to the final decisions. I'm sharing it to demonstrate my process, not polish.
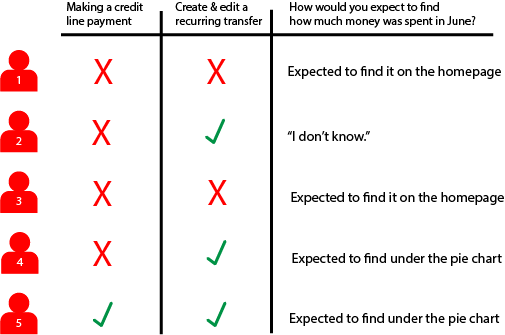
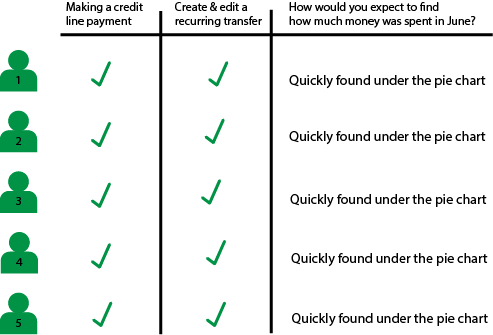
User Testing
This user testing revealed how different users interacted with the original design, where the usability gaps are, and whether the redesign effectively filled those gaps.
Table showing five users' responses on making credit line payments, creating recurring transfers, and where they expect to find June's spending amount, with check marks and crosses for actions and text comments for location expectations.
User interviews before redesign
Table showing five users with icons, each marked for completing 'Making a credit line payment' and 'Create & edit a recurring transfer' tasks, all expecting to find spending under the June pie chart.
User interviews after redesign
Supporting Artifacts
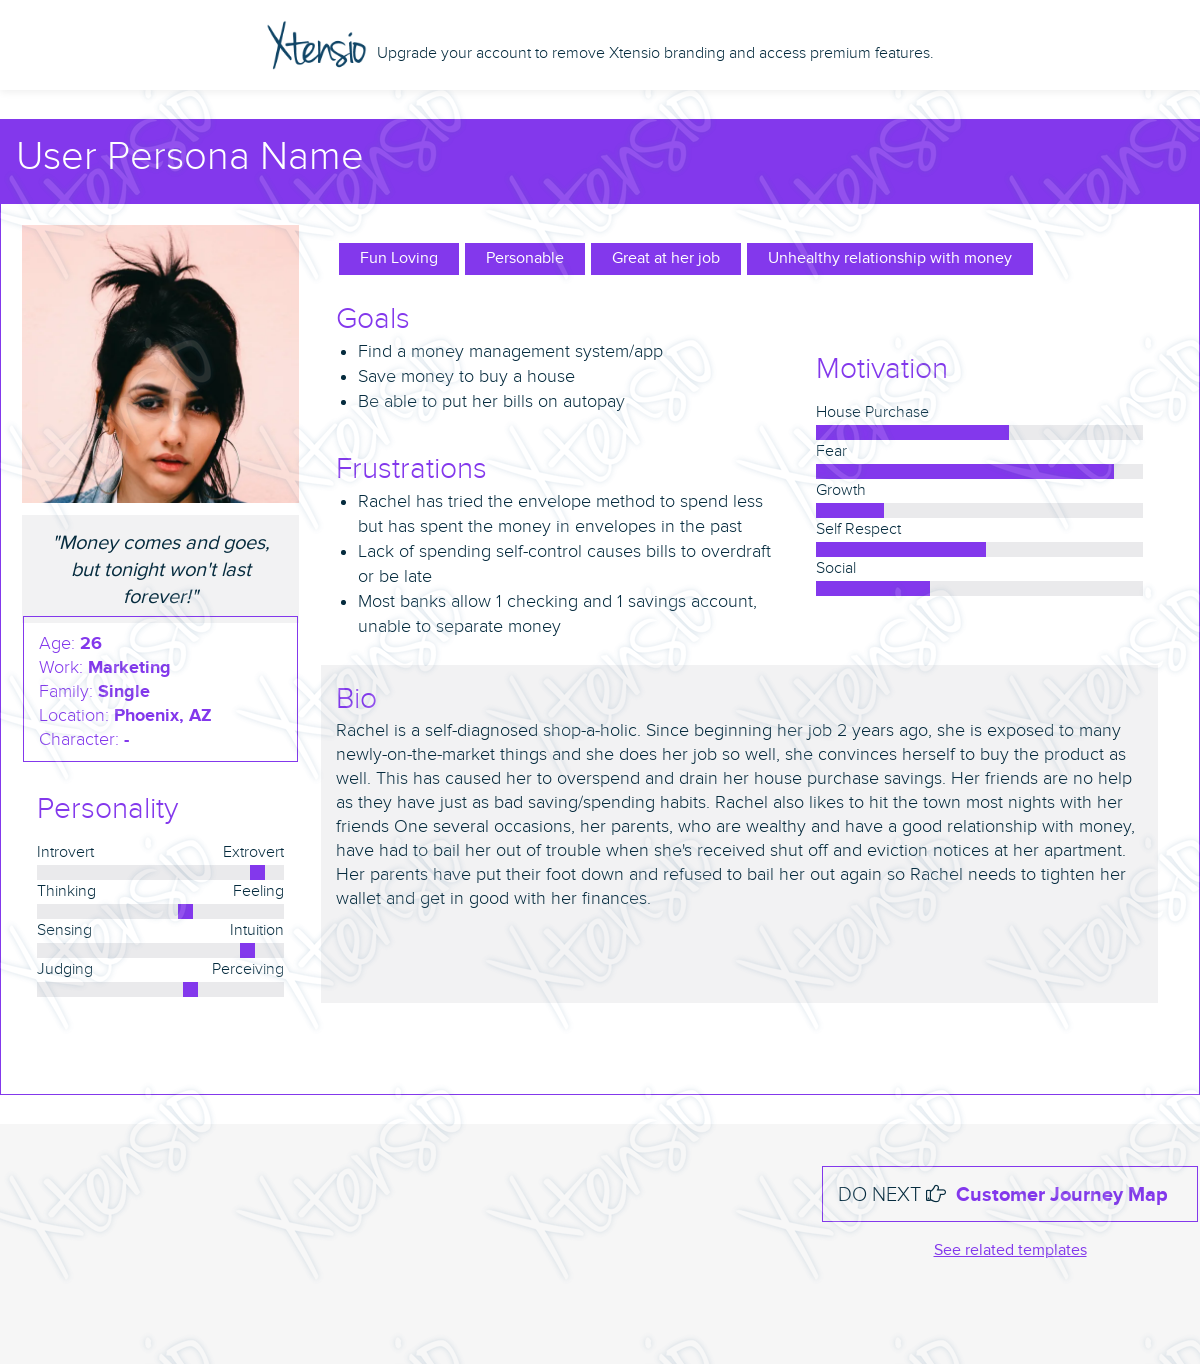
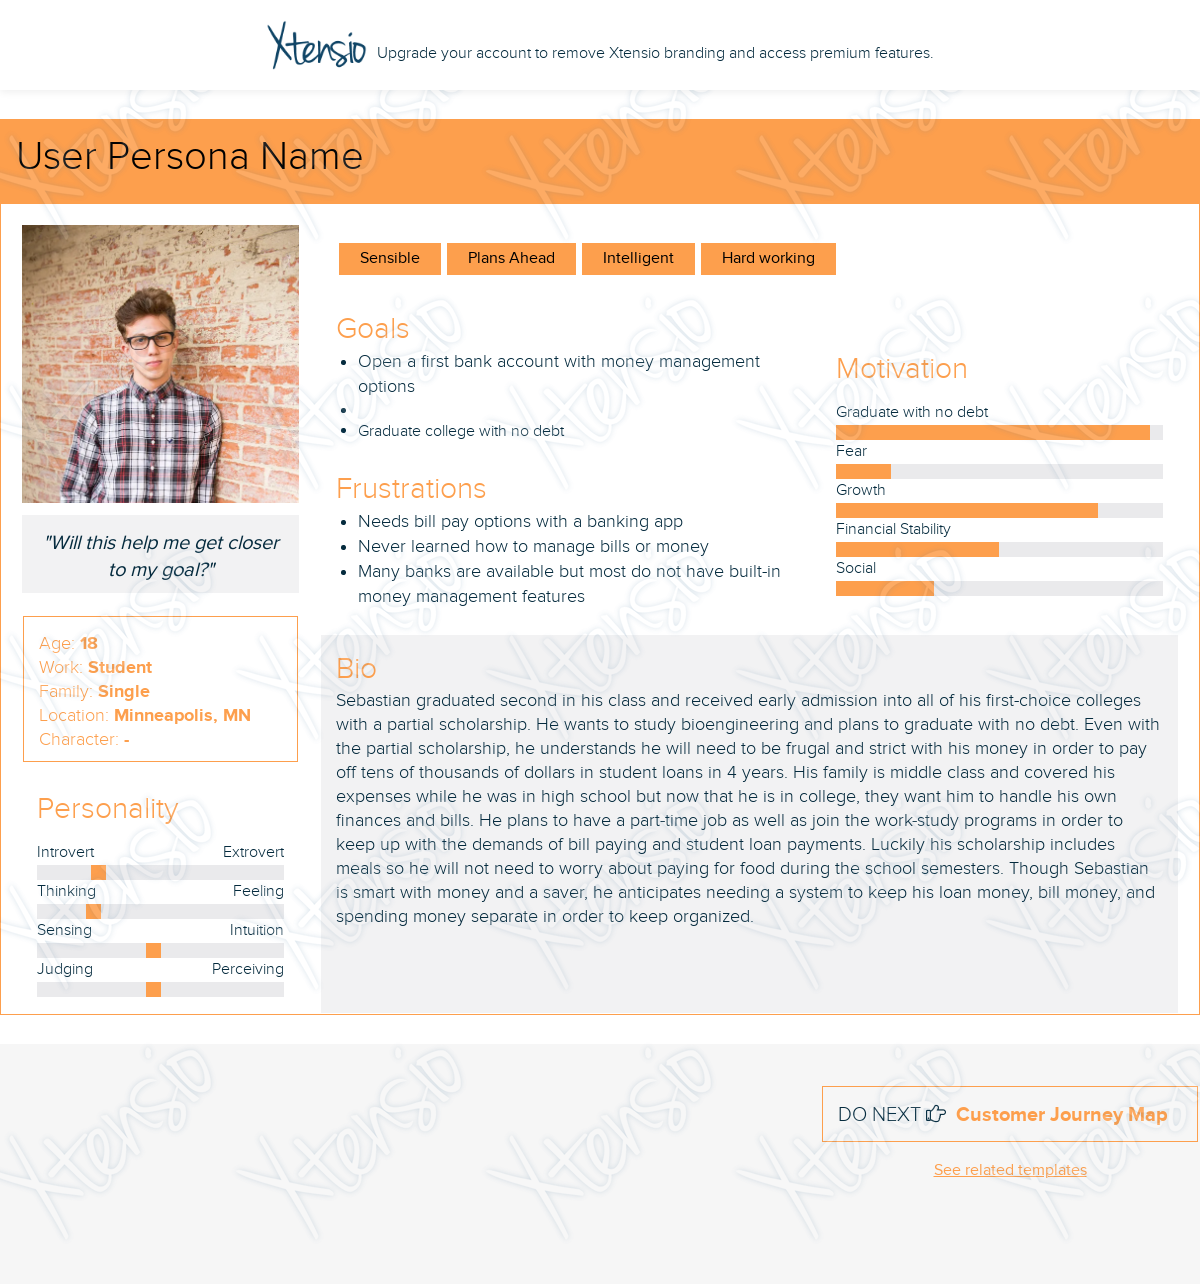
The personas, Rachel and Sebastian, provided clairity on the distinct user archetypes and guided decisions based on their needs and behaviors.
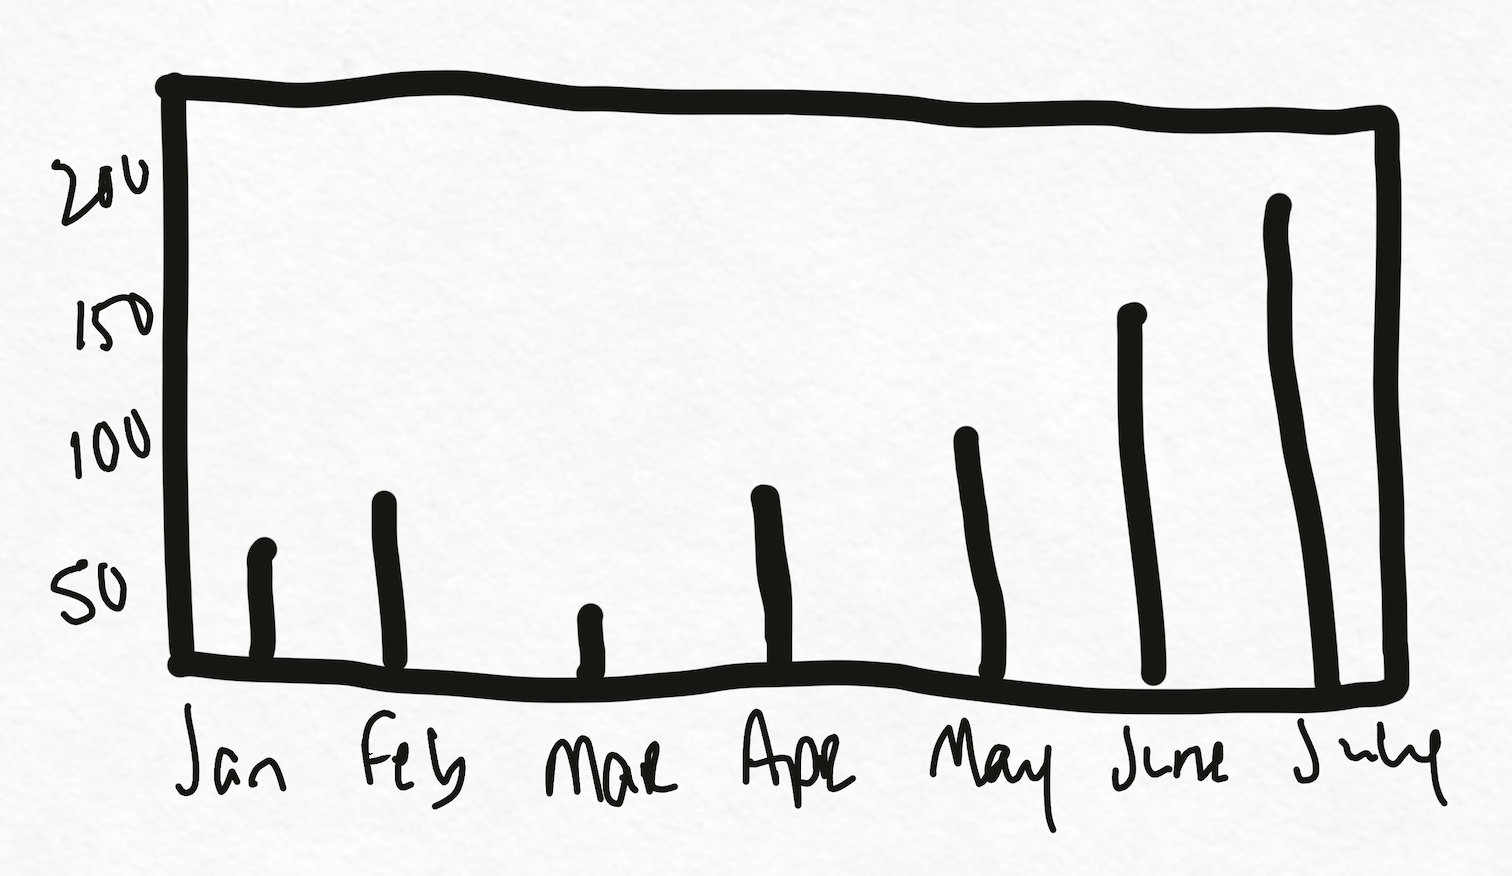
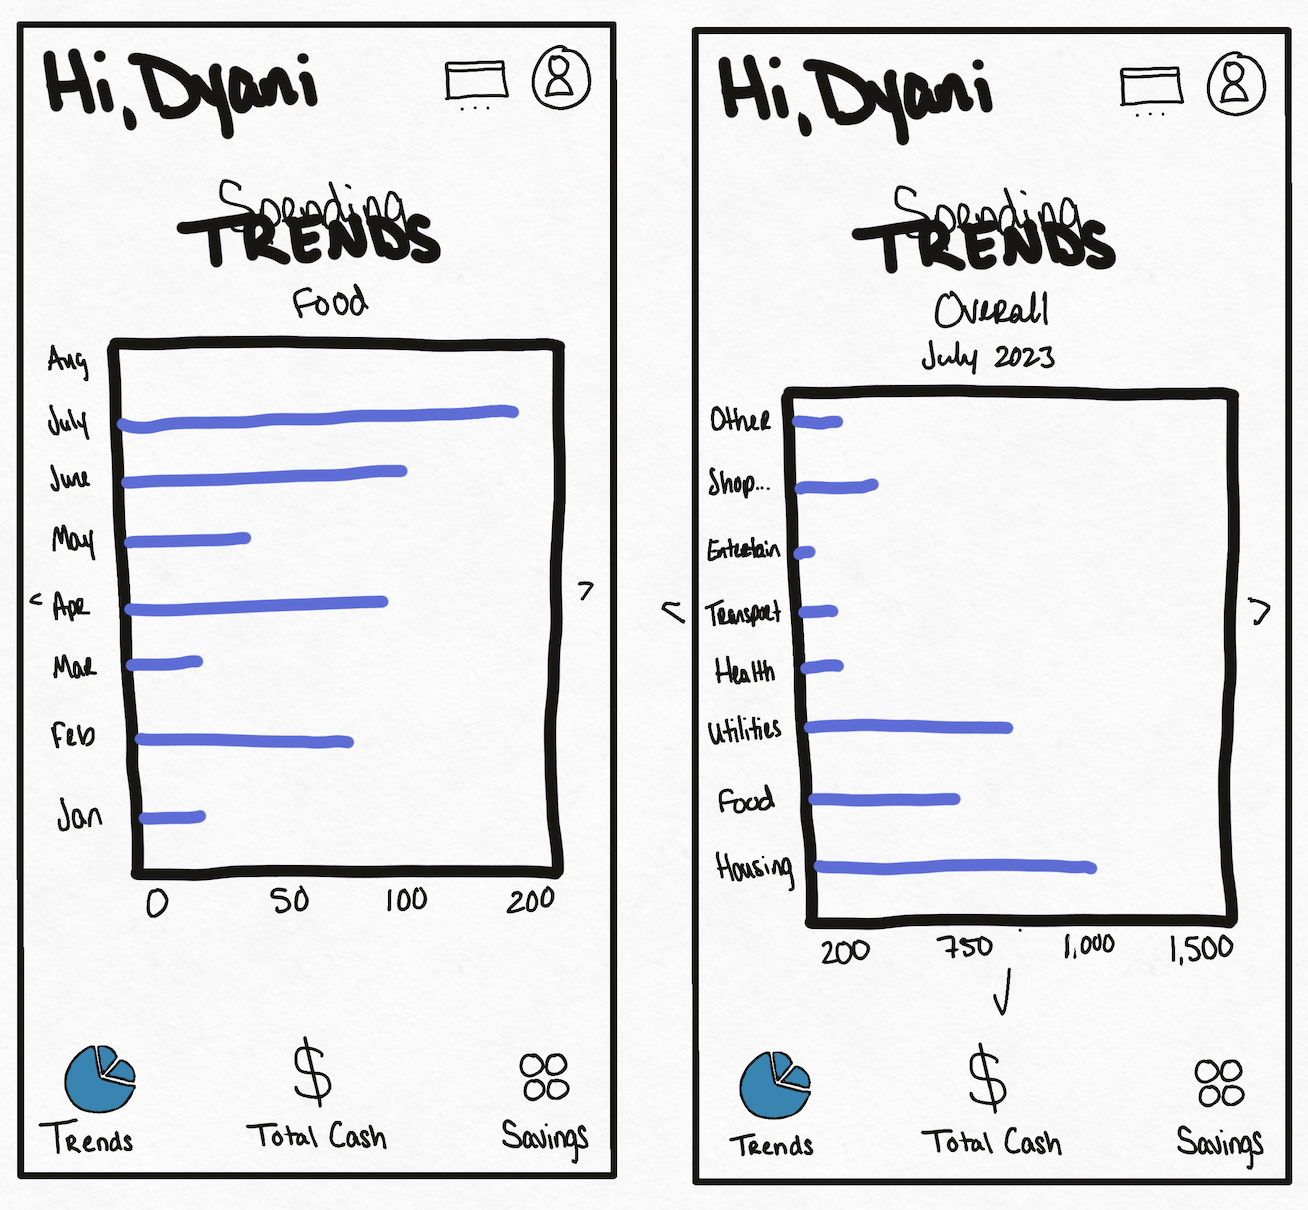
User persona profile featuring a young woman with dark hair, summary of her goals, frustrations, motivation, personality traits, and bio about her financial habits and challenges.User persona profile showing a young man with glasses and brown hair against a brick wall, with sections for goals, frustrations, motivation, bio, and personality traits emphasizing financial management and student life.
Brainstorm Sketches
These hand-drawn sketches and iterations helped me visualize and determine what would make the most sense for everyday use.
Two hand-drawn line graphs; the left graph shows data points labeled no trend line with vertical months and horizontal scale 0 to 200, the right graph labeled trend line shows increasing values from January to July with vertical scale 50 to 200.Hand-drawn bar chart showing monthly values from January to July increasing overall, with the highest bar in July.Two hand-drawn pie charts labeled June 2023 and Food, showing expenses with categories Food, Shopping, Utilities, Housing, and Other, and months January to July with corresponding dollar amounts.Two hand-drawn trend charts addressed to Dyani; left chart shows monthly food spending from January to August with values up to 200, right chart shows overall spending in categories for July 2023 with values up to 1500, both with navigation icons and bottom menu including trends, total cash, and savings icons.
scroll to top arrow